Tradingview
I tried to write a document to guide the tracking of developments on the TradingView side, and I hope it will be helpful. We can start following the developments step by step with the points below.
- Importing the new TradingView DataFeedAPI and UDF folders into the project.
- Updating the methods of the DataFeedAPI.
- Checking the parameters modified to be UDFCompatible against older versions and enabling the new feature sets.
As a starting point, reviewing example repositories and documentation will speed up the process.
Home | Advanced Charts Documentation
GitHub - tradingview/charting-library-examples
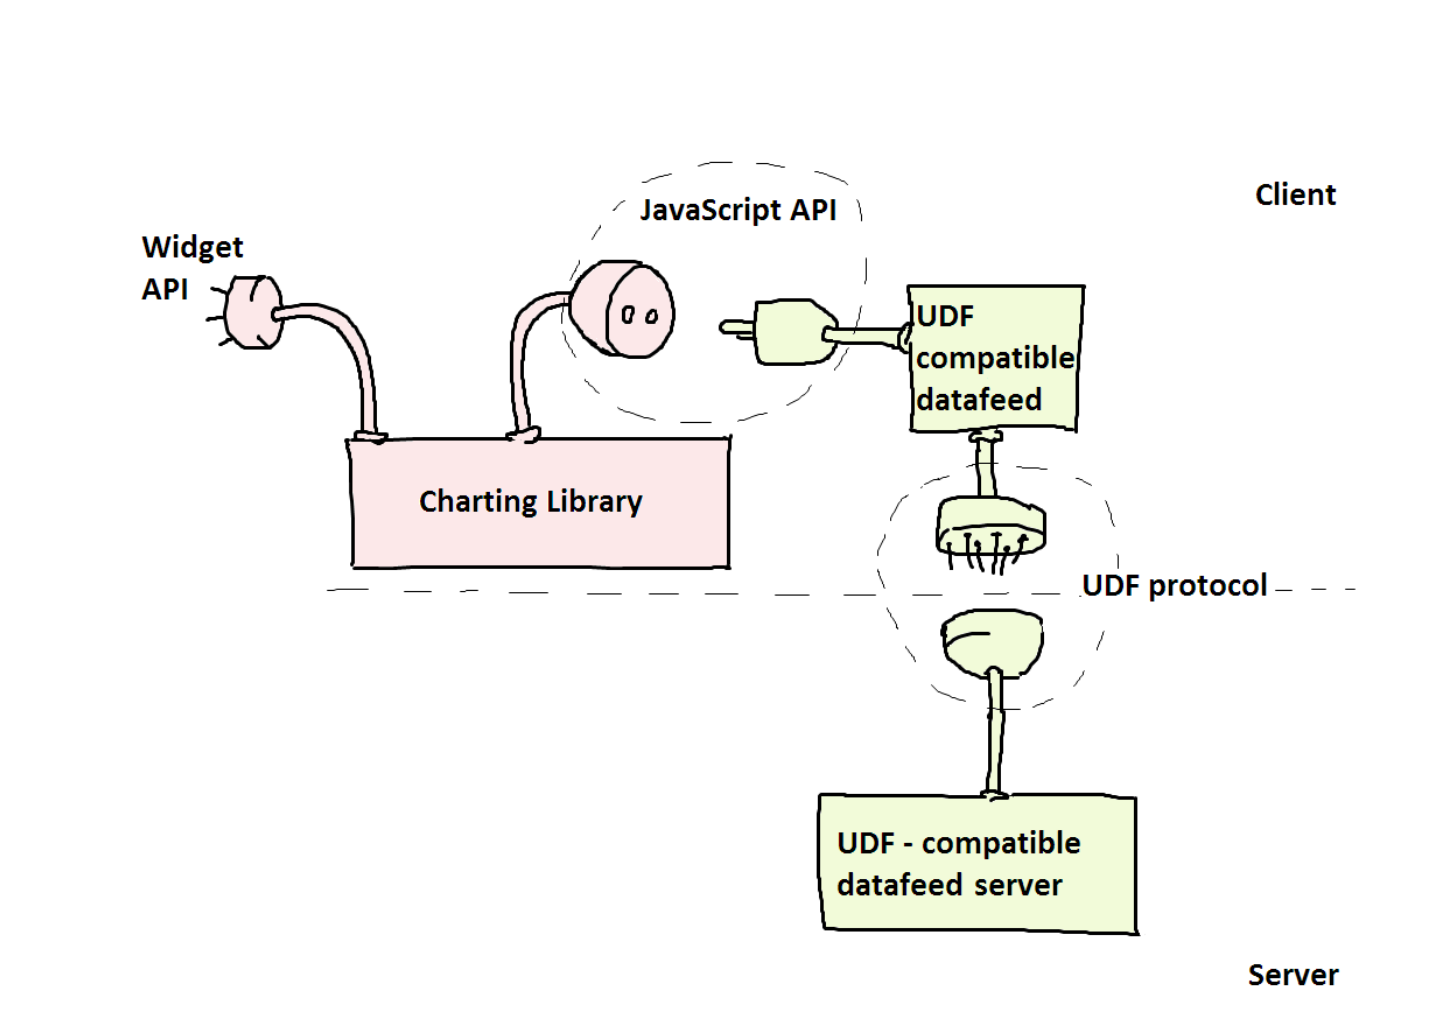
TradingView’s Widget API, Charting Library, and JS API enable seamless integration of advanced charting features with customizable UDF-compatible data feeds, leveraging the UDF protocol to ensure standardized data handling and compatibility across servers for efficient, scalable solutions.
What is a DataFeed UDF?
A user-defined function (UDF) is a protocol used in applications, particularly in packages within the stock market domain, to ensure that development is done according to globally defined rules. It allows the application to be developed based on these rule sets, ensuring that every application is written to a specific standard. For detailed information, you can review the links below.
What is User-defined function ?
UDF | Advanced Charts Documentation
Sure! Here’s the translated content in Markdown format:
1. Package Contents
In the project directory, the /charting_library and /datafeeds folders need to be modified/added for the TradingView setup or update. When adding or modifying TradingView’s existing files, they should be placed into the public folder for Next.js and Angular projects, as shown below.
+/charting_library
  + /bundles
    - charting_library.js
    - charting_library.d.ts
    - charting_library.cjs.js
    - charting_library.esm.js
    - charting_library.standalone.js
    - datafeed-api.d.ts
    - package.json
  + /datafeeds
  + /udf
    - index.html
    - mobile_black.html
    - mobile_white.html
    - test.html
For example installations and files, you can thoroughly review the Next.js and Angular TradingView demo project repositories.
	•	/charting_library contains all the library files.
	•	/charting_library/charting_library* files contain the widget interface of an external library, which should not be modified.
	•	.js is a UMD module (for backward compatibility).
	•	.esm.js is a native JavaScript module, see import.
	•	.cjs.js is a CommonJS module.
	•	.standalone.js is an IIFE module.
	•	.d.ts contains TypeScript definitions for the widget interface.
	•	/charting_library/datafeed-api.d.ts contains TypeScript definitions for the data feed interface.
	•	/charting_library/bundles stores the internal content of the library and is not intended for other purposes, it should be considered a “black box” and can be modified without prior notice.
	•	/charting_library/datafeeds/udf/ contains the UDF-compatible data stream wrapper (which connects to the DataFeed API and applies UDF for data stream connection). It provides an example of real-time data feeding. The code here can be customized on a project basis.
	•	/index.html is an example of using the library widget on your webpage. It has been added to show how it should be implemented in the projects.
	•	/mobile*.html are examples of widget customization.
To check the version in the browser, use TradingView.version() in the console. For updating the package to a new version, refer to the “Update the library | Advanced Charts Documentation” document.
TradingView Widget Constructor
The Widget Constructor | Advanced Charts Documentation is where you add the required basic information when creating a widget. The widget constructor should be added as required in the constructor document. For unused parameters, simply follow the link based on the desired skillset and add them to the constructor.
let DatafeedConfiguration = {
  name: symbolName,
  description: symbolName,
  ticker: symbolName,
  session: '24x7',
  minmov: 1,
  pricescale: this._precision,
  has_intraday: true,
  timezone: 'UTC',
  has_daily: true,
  has_weekly_and_monthly: true,
  supported_resolutions: this.configurations.supported_resolutions,
};
2. Implementation & Services
Here’s the translated content in Markdown format:
Widget Constructor and Methods
After creating an iframe with the Widget Constructor, you can control the window element object using the methods defined in the IChartingLibraryWidget interface. This article explains the most commonly used methods. You can visit the IChartingLibraryWidget page for a complete list of methods. Below are some frequently used methods:
🚀 onReady()
After initializing the iframe, the onReady method needs to be called. This method provides the data feed configuration information, such as supported symbol types, exchanges, time intervals (resolution), currency codes (e.g., PAIR_TRY), and more. It is necessary to call the onReadyCallback and pass a DatafeedConfiguration object as a parameter.
Warning: The setTimeout function does not behave the same when using Promise or async/await. Despite setTimeout not being a preferred structure, it has been requested to be used in the implementation documentation.
onReady: (callback) => {
    console.log('[onReady]: Method call');
    setTimeout(() => callback(configurationData));
}
🚀 getBars(...)
The getBars method is used to retrieve historical data for a specific range and plot it on the chart. While drawing the requested data on the chart, the Bar object should be adjusted to the desired number and sent to the HistoryCallback.
Warning: When common issues occur, it may speed up the process to review the getBars documentation in the “Datafeed API | Advanced Charts Documentation.”
getBars(
  symbolInfo, // PAIR_TRY, PAIR_USDT (Symbol information)
  resolution, // e.g., 1, 5d (time info)  1d, 1m (Time bar range info)
  periodParams, // { from, to, countback } (The time range from and to epochs, and the countback parameter, for example, “TradingView needs 300 bars.”)
  (bars: TradingViewBar[], meta: TradingViewMeta) => onHistoryCallback(bars, meta), // Adds bars to the chart using a recursive method
  (e) => {
    // Executes when an error occurs
    this._loading = false;
    onHistoryCallback([], { noData: true });
  },
  firstDataRequest
);
If 300 bars are expected and the 300 bars are received, the chart will be plotted. If less than 300 bars (e.g., 270) are received, another request will be sent to retrieve the remaining bars (e.g., 30 bars) from the requested epoch range.
onHistoryCallback is a recursive Promise chain method that manages requests, ensuring that data is collected and stored in an array.
Warning: This function cannot be modified as the sendRequester Promise chain method controls it. Interrupting requests within it may lead to an increased error margin.
For more detailed information on periodParams and onHistoryCallback, refer to the following documents: • PeriodParams | Advanced Charts Documentation • HistoryMetadata | Advanced Charts Documentation
🚀 subscribeBars(...)
The library uses the subscribeBars method to get real-time updates for a symbol. When the latest bar needs to be updated or a new bar needs to be added, the onTick method within subscribeBars should be called. For example, if the chart is loaded until 14:00, it will only update the last bar (14:00) or add a new bar (15:00).
For more information, visit the Datafeed API | Advanced Charts Documentation.
🚀 unSubscribeBars(...)
When a user selects another symbol on the chart, the unSubscribeBars function is called to stop receiving updates for the symbol. For more information, visit the Datafeed API | Advanced Charts Documentation.
🚀 subscribe(...)
The subscribe method listens for events in the chart, similar to an event listener. Events like study and panes_order_changed are specified with strings as described in the SubscribeEventsMap | Advanced Charts Documentation.
Here’s an example of subscribing to events and using localStorage to store the user’s chart and filter settings, ensuring that the user’s data is preserved when they return or refresh the page.
widget.subscribe('study', (study) => {
  if (!distinctNames.includes(study.value)) {
    distinctNames.push(study.value);
    localStorage.setItem(localStorageKey, distinctNames.toString());
  }
});

widget.subscribe('panes_order_changed', () => {
  let studies = this._tvWidget.activeChart().getAllStudies();
  let distinctNames = studies
    .map((x) => x.name)
    .filter((value, index, self) => self.indexOf(value) === index);
  if (distinctNames.length > 0) {
    localStorage.setItem(localStorageKey, distinctNames.toString());
  } else {
    localStorage.removeItem(localStorageKey);
  }
});
For the list of listeners within the chart, you can explore more in the SubscribeEventsMap | Advanced Charts Documentation.
🚀 headerReady(...)
After the chart DOM is initialized, the headerReady function should be used to add new components like buttons and dropdowns to the TradingView lifecycle. For example, you can use it to add fullscreen, save, and load buttons to the header.
widget.headerReady().then(() => {
  // Fullscreen, save, and load JSON buttons
  widget.createHeaderButton(
    '<div class="chart-save-load-button chart-fullscreen-button"><svg xmlns="http://www.w3.org/2000/svg" width="18" height="18" viewBox="0 0 32 32" id="i-fullscreen" fill="none" stroke="currentcolor" stroke-linecap="round" stroke-linejoin="round" stroke-width="2"><path d="M4 12 L4 4 12 4 M20 4 L28 4 28 12 M4 20 L4 28 12 28 M28 20 L28 28 20 28"></path></svg></div>',
    'Fullscreen button',
    function () {
      if (!document.fullscreenElement) {
        document.getElementById('tvchart').requestFullscreen();
      } else {
        if (document.exitFullscreen) {
          document.exitFullscreen();
        }
      }
    },
    { align: 'right' }
  );
});
3. Localization & Custom Language
Localization Folder for TradingView when updating TradingView existing path, the provided folder includes both datafeeds and charting_library components.
+/charting_library
  + /bundles
    - charting_library.js
    - charting_library.d.ts
    - charting_library.cjs.js
    - charting_library.esm.js
    - charting_library.standalone.js
    - datafeed-api.d.ts
    - package.json
For example installations and files, you can thoroughly review the Next.js and Angular TradingView demo project repositories.
Language Files Removal
Within the /charting_library/bundles folder, any files that begin with es, fr, or ch should be removed, as they are language files we do not support and are unnecessary. Only the files that begin with tr and en should be kept and added to the project.
4. Creating Custom Indicators Using TradingView JSAPI
The TradingView JSAPI allows us to create custom indicators. This can be done by writing it in Pine Script or simply adding a specific meta info definition. JSAPI enables you to create various indicators using different drawing types, styles, colors, and mathematical functions. Users can add a custom indicator to a chart and modify some of its parameters using the Indicators and Settings dialog in the user interface.
For TradingView documentation on indicators, you can refer to:
Indicators List | Advanced Charts Documentation
Custom Indicators | Advanced Charts Documentation
The package in TradingView comes with certain built-in indicators. For example, to add the “Hull Moving Average” indicator, you just need to follow the meta info structure as described below.
Example MetaInfo for Hull Moving Average Indicator:
{
  name: 'Hull Moving Average',
  metainfo: {
    _metainfoVersion: 52,
    isTVScript: false,
    isTVScriptStub: false,
    is_hidden_study: false,
    defaults: {
      styles: {
        plot_0: {
          linestyle: 0,
          linewidth: 1,
          plottype: 0,
          trackPrice: false,
          transparency: 0,
          visible: true,
          color: '#2196F3',
        },
      },
      inputs: { in_0: 9 },
    },
    plots: [{ id: 'plot_0', type: 'line' }],
    styles: {
      plot_0: { title: 'Plot', histogramBase: 0, joinPoints: false },
    },
    description: 'Hull Moving Average',
    shortDescription: 'HMA',
    is_price_study: true,
    inputs: [
      {
        id: 'in_0',
        name: 'length',
        defval: 9,
        type: 'integer',
        min: 1,
        max: 10000,
      },
    ],
    id: 'Hull Moving Average@tv-basicstudies-1',
    scriptIdPart: '',
    name: 'Hull Moving Average',
    format: { type: 'inherit' },
  },
}
Some of the indicators sometimes not working or not compitable for the current UDF or Tradingview version. To hide indicators, you can use the metaInfo structure. Simply add is_hidden_study: true in the meta info for the indicator.
For more details, you can refer to: MetaInfo | Advanced Charts Documentation